Webscraping and animated visualization of ETTJ [Python] and [R]
· 1 min read
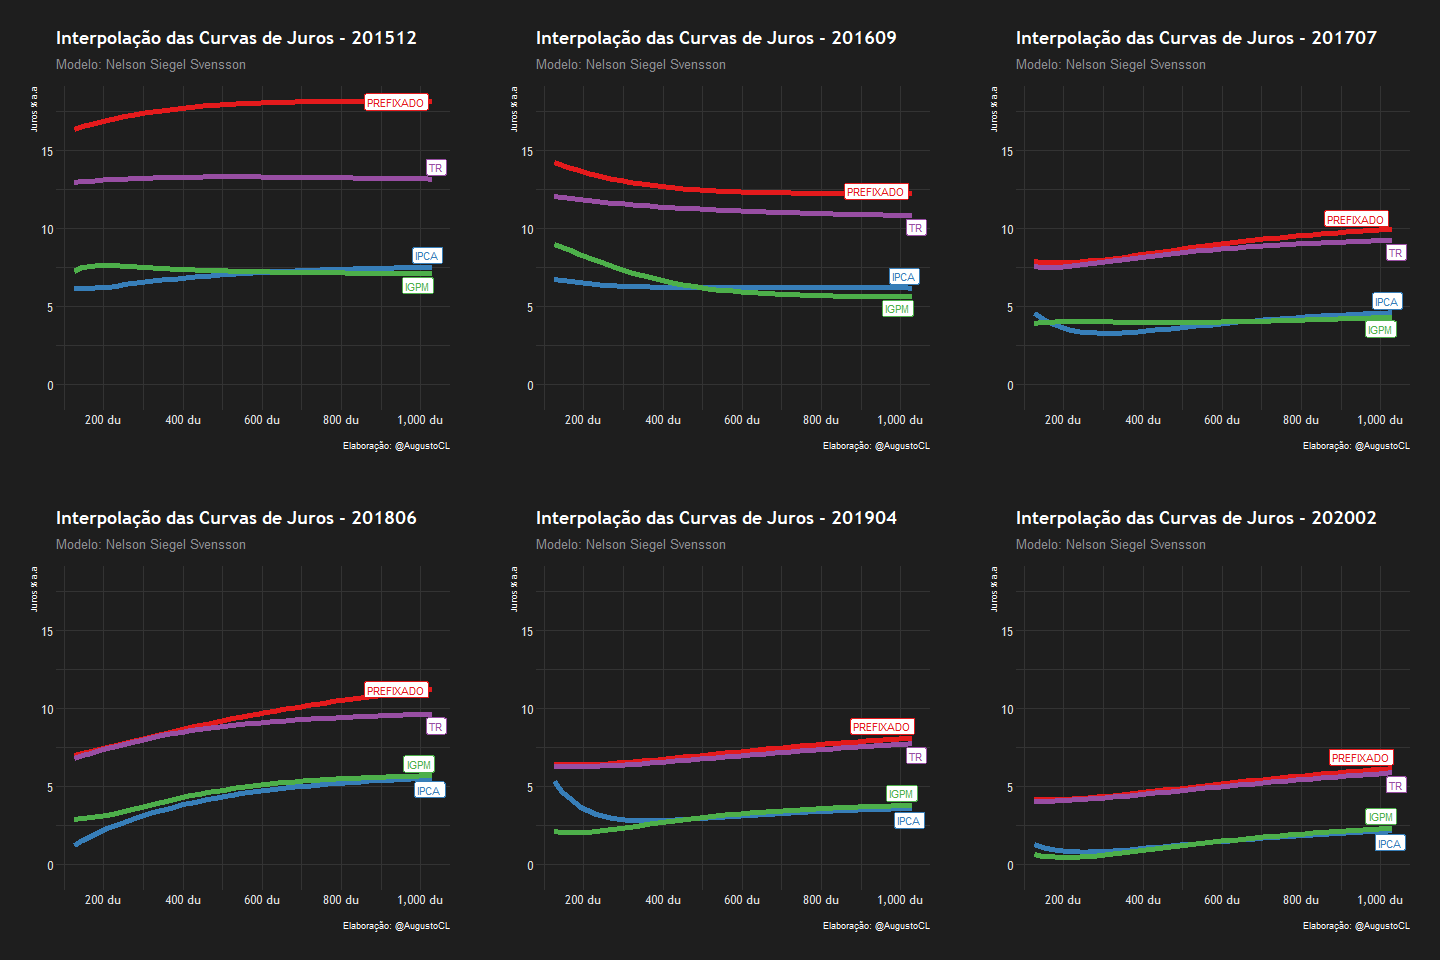
This project uses the NelsonSiegelSvensson yield curve model, which is used by SUSEP, ANBIMA, and several Central Banks worldwide, to generate: - The history of future yield curves pre, ipca, igpm, and tr extracted directly from the SUSEP website via Webscraping. - An animated visualization (gif) of the historical behavior of each curve.

Tools used
- [Python] for webscraping that automates data collection and applies the yield curve model.
- [R] for data cleaning, processing, and creating the final gif.
Brief Code Description
The .py script extracts all monthly parameters made available on the SUSEP website, processes the data into a structured table output, and uses the parameters to generate all future curves, producing the final output in .xlsx format. The .R script processes the .xlsx data and generates the .gif animation with the history of the 4 curves in the same visualization.

