Analyzing a Stock Portfolio [R] [Shiny]
This project is an interactive dashboard where you can analyze a portfolio of up to 5 assets, from 4 viewpoints (return, standard deviation, skewness, and kurtosis).
The entire dashboard was built with the R language, using the following tools:
- Shiny (Dashboard Reactivity)
- Flexdashboard (Quick Dashboard Template)
- Highcharter (JavaScript Chart Visualization)
- Tidyquant (R package that brings data from Yahoo Finance)
The project’s goal was to generate a set of relevant visualizations for a descriptive analysis of a portfolio, using knowledge learned from the book Reproducible Finance with R. Since this is an application of the book’s knowledge, feel free to use it as a supplement to the book’s content and your personal studies.
Enjoy the interactivity of the charts in the dashboard and experiment with time filters, reactive charts, and other features that Highcharter provides to enhance your analysis.
The entire project code is available at this link on Github.
INPUTS
TICKER: Since the dashboard feeds from Yahoo Finance, all assets on the platform can be added to the dashboard and must follow Yahoo’s ticker format.
| Brazilian Stock | American Stock |
|---|---|
| WEGE3.SA (WEG) | SBUX (Starbucks) |
If in doubt about the correct ticker, go to Yahoo Finance to find the desired assets.
WEIGHTS: Make sure the weights add up to 100% for the dashboard calculations to work. For this, the ‘Calculate’ button is only enabled when the weights sum to 100%.
DATES: When selecting the start and end dates for analysis, ensure that all 5 stocks are available within this period. If any company is not available in the interval, the portfolio calculations will break. –> (This case is included in the improvement list below)
PERIODICITY and ROLLING WINDOW: Use these options to detail your analysis. Log-returns will be analyzed according to the selected periodicity (annual, monthly, and weekly), and the rolling window allows you to observe the historical behavior of portfolio risk measures such as standard deviation, skewness, and kurtosis.
Summary of the 4 Views
Log-Returns: To evaluate the historical distributions of returns, it is necessary to use log-return to equalize the weights for positive and negative actual returns. Access this link for a better understanding of the need for log-return in evaluating cumulative returns.
Standard Deviation: Indicates the degree of dispersion of asset log-returns around their mean. The higher the standard deviation, the more volatile (risky) the asset’s log-return.
Skewness: Describes the historical behavior of returns through the skewness of their distribution relative to the mean. Since log-return means tend to zero, negative skewness indicates a strong presence of positive returns, while positive skewness indicates large negative returns. 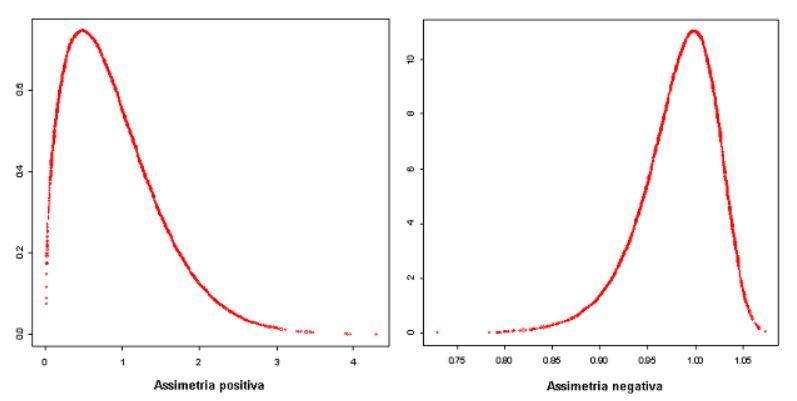
Kurtosis: Describes the intensity of extreme values in the return distribution. Low kurtosis means a large number of extreme returns in the asset’s history, while high kurtosis means fewer extreme returns. 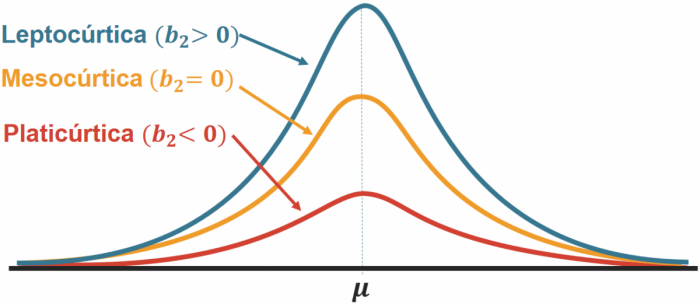
Note: Illustrations taken from Portal Action
Lista de Melhorias
Obs.: A sequência das melhorias não indica ordem de prioridades.